
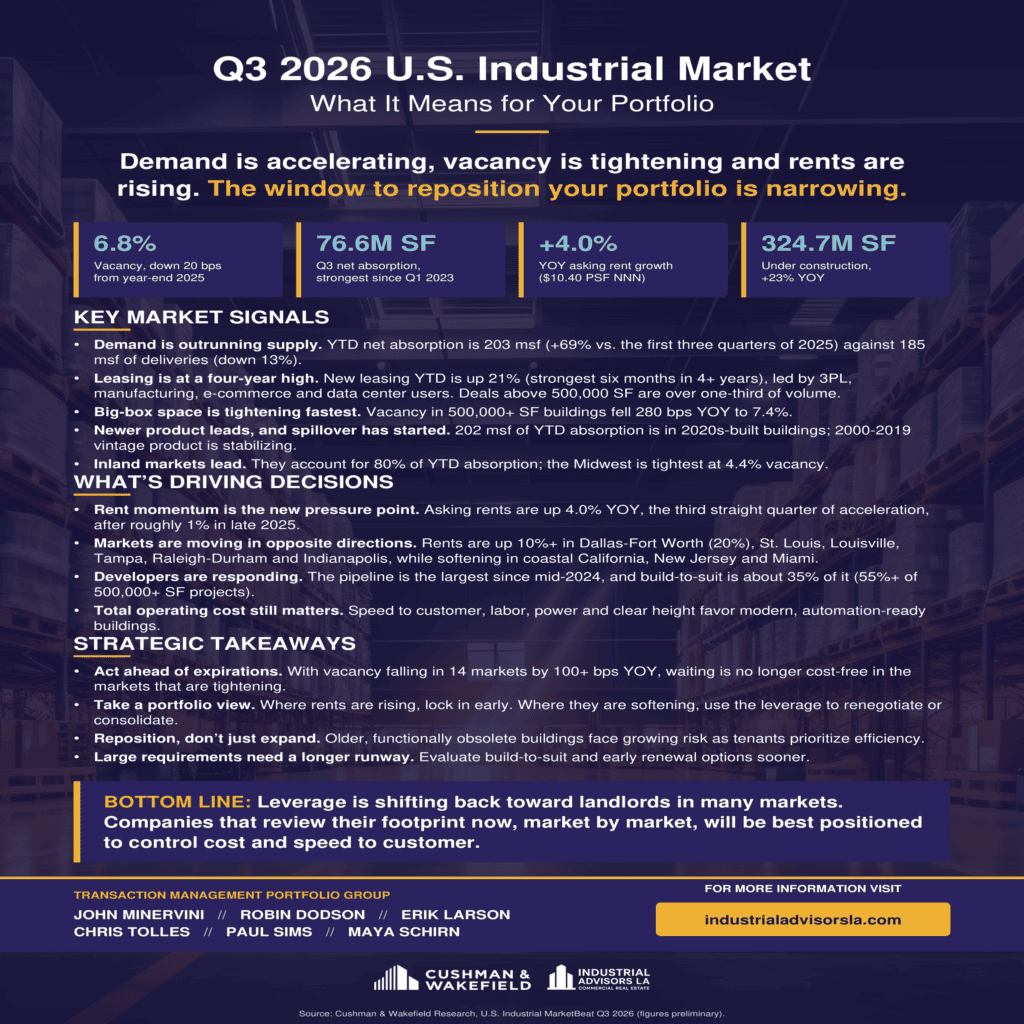
Our team has been watching the third-quarter numbers closely, and the story they tell is hard to ignore. Demand is accelerating, vacancy is tightening, and rents are moving up. For tenants, the old habit of waiting until a lease is almost over before making a decision is starting to look expensive.
Here is a snapshot of where the national industrial market stands after Q3, and what we think it means for your portfolio.
What the numbers say
Net absorption reached 76.6 million square feet in the third quarter, the strongest quarter since early 2023. National vacancy fell to 6.8%, down 20 basis points from the end of 2025. Asking rents are up 4.0% year over year, landing at $10.40 per square foot NNN, and that is the third quarter in a row where rent growth has picked up speed. Late last year it was running at roughly 1%.
Supply is trying to catch up. There are 324.7 million square feet under construction, 23% more than a year ago, and the pipeline is now the largest since mid-2024. But so far, demand has the upper hand. Year-to-date absorption stands at 203 million square feet, up 69% from the same period in 2025, while deliveries total 185 million square feet and are down 13%.
Where the demand is coming from
New leasing is up 21% so far this year, and the last six months were the strongest in over four years. Third-party logistics providers, manufacturers, e-commerce companies and data center users are leading the way. Deals above 500,000 square feet account for more than a third of all volume.
That size segment is also where the squeeze is sharpest. Vacancy in buildings of 500,000 square feet or larger dropped 280 basis points over the past year, to 7.4%. If your operation needs that kind of space, your options are shrinking faster than the national average suggests.
New buildings lead, and the spillover is starting
Almost all of this year’s absorption, 202 million of the 203 million square feet, went into buildings delivered in the 2020s. It makes sense. Speed to customer, labor availability, power and clear height all matter more than they used to, and modern, automation-ready buildings handle those demands better.
There is a bit of encouraging news for owners and occupiers of slightly older product. Buildings from the 2000 to 2019 vintage are stabilizing, which points to some spillover as the best new space gets taken. Functionally obsolete buildings are another matter. As tenants focus on efficiency, those properties carry more risk every quarter.
Inland markets are setting the pace
Inland markets generated 80% of year-to-date absorption. The Midwest is the tightest region in the country, with vacancy at just 4.4%. If you operate there, you already know how competitive it has become.
Leverage is moving back toward landlords, but not in every market
This is the part of the picture we want tenants to take seriously. Nationally, leverage is shifting back toward landlords. Locally, the story varies a lot.
Rents are up by double digits in Dallas-Fort Worth (where growth is closer to 20%), Indianapolis, Louisville, St. Louis, Tampa and Raleigh-Durham. Meanwhile, rents are softening in coastal California, New Jersey and Miami. Same quarter, same national trend, very different outcomes depending on the zip code.
A tenant with locations in both Dallas and New Jersey, for example, is dealing with two separate negotiations. In one, the landlord holds most of the cards. In the other, the tenant may have room to push for better terms or consolidate.
Less about adding space, more about repositioning
When people hear that demand is strong, the first instinct is often to lock up more square footage. We would argue that is usually the wrong conclusion. More space does not fix a building that is too slow, too costly to staff or too far from your customers.
The better question is where your footprint should be, and what it costs to run. Total operating cost, including labor, power, transportation and throughput, should drive the decision, along with how fast you can reach your customer. That means looking at the portfolio market by market and asking which locations are working, which are not, and which leases are coming due.
Timing matters
Vacancy has fallen by 100 basis points or more year over year in 14 markets. In those markets, waiting is no longer free. Every month you hold off, you give up options, and the landlord gains negotiating power.
Our advice is to start early, ideally well ahead of your lease expirations. Where rents are rising, locking in sooner can protect you from steeper increases. Where they are softening, use the leverage to renegotiate or consolidate. And if you have a large requirement, say 500,000 square feet or more, give yourself a longer runway. Build-to-suit now makes up about 35% of the construction pipeline, and more than 55% of projects over 500,000 square feet. Big users are commissioning space because the existing choices are thin.
Let’s compare it against your footprint
Our Team put together a one-page view of what these trends mean for your portfolio, and we are glad to walk through it with you. At Industrial Advisors LA, we help clients execute across multiple markets using a consistent, data-driven process, so every decision is grounded in the same set of facts.
If it would be useful, we can compare this data against your current footprint and point out where the opportunities might be. Do you have 20 minutes for a call next week? We are happy to work around your schedule.
Sources: Cushman & Wakefield Research (Q3 2026, preliminary); U.S. Census Bureau construction data; Industrial LA Team intel.

 Erik Larson