Los Angeles Industrial Property Sector Insights
Despite a prolonged slowdown, the Los Angeles industrial property sector ended 2025’s last quarter with fresh upward movement. Not long ago shaped by pandemic fallout, higher borrowing costs, and shifting logistics patterns, conditions today reflect greater equilibrium. Leasing volume, space taken, and vacant warehouse levels all indicate gradual improvement. Rather than sharp rebounds, recent trends suggest steady recalibration is underway. What emerged was less volatility, more predictability across key metrics. By late 2025, momentum had quietly reappeared.
Five insights define the industrial scene in Los Angeles by late 2025. Notable shifts emerge across logistics space usage during this period. Rents continue rising, yet availability shrinks noticeably citywide. Developers focus on repositioning older buildings instead of new construction. Supply chain adjustments influence how companies occupy warehouse areas.
1. Leasing Hits Highest Annual Mark in Years
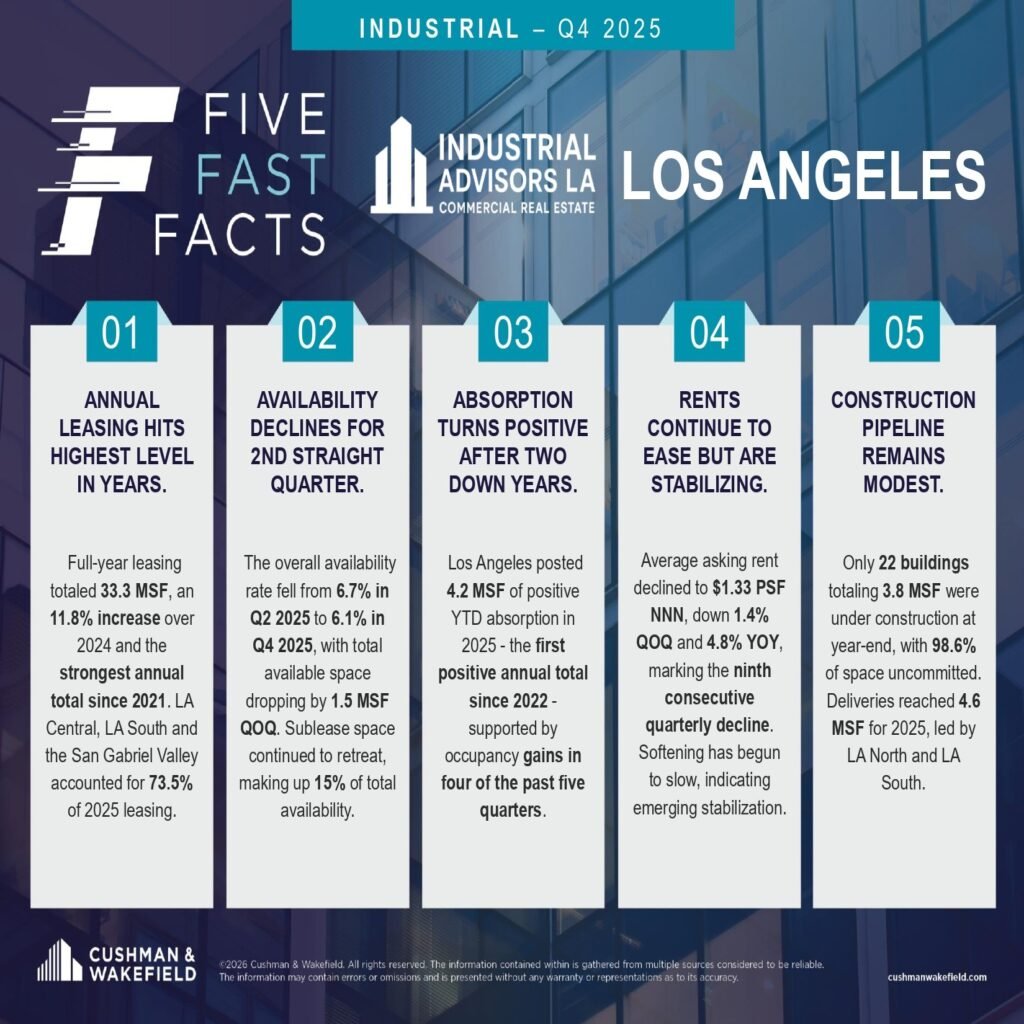
Beginning anew, leasing hit 33.3 million square feet in 2025, a rise of 11.8% from the prior year, the highest yearly figure since 2021. Following restraint during 2023 and 2024, logistics firms, distribution networks, alongside local tenants, showed stronger commitment through expanded space uptake. Despite earlier hesitation, market engagement picked up meaningfully by mid-year. Confidence returned, visible in sustained transaction volume across industrial zones.
Nearly three out of four leases occurred in regions such as LA Central, LA South, and the San Gabriel Valley, totaling 73.5%. Because these locations sit near major populations, their appeal remains strong; port connections add further advantage. Industrial activity finds support here due to long-standing facilities already in place. A shift appears underway: firms once holding back moves are stepping back into negotiations despite earlier hesitation.
2. Availability Down Again This Quarter
Later in the cycle, availability began to shrink after an earlier high, falling from 6.7% to 6.1% between Q2 and Q4 of 2025. A reduction of 1.5 million square feet in total vacant area followed, suggesting a market under growing pressure.
Surprisingly, sublease supply keeps shrinking, standing at just 15% of overall available space. When demand slows, extra leased areas usually appear more often on the market. Now, fewer listings suggest companies adjust less by shedding space, instead holding onto it. This shift hints at firmer usage patterns taking shape across occupied buildings.
3. Absorption Turns Positive
So far in 2025, Los Angeles has seen 4.2 million square feet added to occupied space, this stands as the first full-year gain since 2022. Notably, four out of the past five quarters contributed to that upward trend.
Demand now exceeds new supply returning to availability, shown by positive absorption. Though less intense than during the peak years of the crisis period, current levels reflect steady progress. The shift points toward balanced development instead of rapid, unstable increases. Signs indicate adjustment toward stable conditions, away from exaggerated rises fueled by speculation.
4. Rents Keep Falling But Slow Down
Downward pressure on pricing continues, as typical lease rates settled at $1.33 per square foot NNN. A shift of 1.4% appears when compared to last quarter. Year-on-year, values fall by 4.8%. Nine quarters in a row now show easing levels.
Still, the drop has eased notably, possibly hinting at steadier ground ahead. Lease talks now lean toward renters, opening space for perks like fit-out support. Where construction lags, especially in central pockets, rates might stop falling soon.
Limited space in Los Angeles, combined with steep market hurdles, reduces the chances of lasting drops in rental rates. Despite shifts, persistent forces shape demand, port operations play a role, logistics needs matter just as much, while the region’s large population underpins stability. Value remains anchored, not by trends, but by these deeper currents pulling through time.
5. Construction Activity Still Limited
At year-end, just 22 structures were rising, amounting to 3.8 million square feet, a modest total suggesting limited activity. Notably, nearly all of it, precisely 98.6 %, sits without commitments, a sign caution guides current building decisions.
Four point six million square feet moved through in 2025, driven largely by activity across LA North and also parts of LA South . Unlike earlier growth phases, incoming inventory stays modest in scale. With flows kept in check, excess capacity seems unlikely, stability into 2026 may folow as a result. Supply restraint becomes noticeable when contrasted against historical patterns.
Market Seeks Steady Ground
By late 2025, stability begins shaping the industrial landscape of Los Angeles. Demand shows renewed strength in leasing activity. Availability narrows across submarkets. Positive absorption emerges after extended contraction. Rent reductions slow, signaling pricing resilience. Construction continues at a measured pace, avoiding excess supply.
This pattern suggests a shift toward improved balance by 2026. Yet subtle adjustments may define its actual path. Still, longer-term rhythms appear less strained than before. Meanwhile, underlying conditions support steadier progression. Because earlier disruptions have eased somewhat. Therefore momentum builds without excess strain. Until new patterns take clearer shape.
With prices leveling off, investors may find specific openings worth considering. Before shifts occur once more, tenants could benefit from present terms. A stronger outlook begins to emerge for property holders, backed by gradual improvements below the surface.
Stability tends to arrive just before expansion resumes within highly restricted, critical sectors nationwide. Nowhere is this more visible than in Los Angeles. Phase shifts tend to emerge quietly, this city may already be shifting.